
Columnist; Science and Academics
A lottery game, like any commercial game of chance, is built on a mathematical model that ensures profitability for operators while remaining attractive to players.
The mathematical model behind a lottery game is grounded on a set of parameters that define the game and are employed when computing its statistical indicators, like probabilities of winning, expected value, house edge, and other averages. These parameters express the mathematical nature of the outcomes of a draw and the prize schedule of the game. All these mathematical and statistical facts behind a lottery game represent its “blueprint” and are useful for the players to play informed and make the right choices, either when choosing between several games or for the way to play a certain game.
We started The Math Behind series as a quick guide for lottery players, where we present the math facts behind the lottery games. This piece focuses on Powerball, one of the most popular lottery games worldwide.
As the first article in the series, here's what mathematical information we'll provide and how we'll present it:
Category
In this section, we will frame the game into a category with respect to the mathematical nature of its outcomes and show the basic parameters defining the game, in terms of the draw and the played lines. Special features or add-ons of the game are also mentioned.
Prizes
Here, we will present a brief analysis of the prizes available for the Powerball game, highlighting its specificities.
Odds of winning
This section will highlight the specificities of the odds associated with the prizes and, if applicable, show how they change with the options offered in the game.
Average win and fairness
The table presented in this section shows the values of two notions associated with each prize:
- Average win: This is a statistical indicator expressing how much of a prize is won on average per draw over the long run, under the assumption that the prize is won with the relative frequency given by its probability.
It is computed as the product Average win = (Amount of the prize) x (its probability). This indicator employs the gross win and not the investment (the cost of the tickets). - Fairness: This measures how fair a certain association of prize and odds of winning, relative to a zero-expectation fair bet, is. Such a bet has 100% fairness. Fairness is specific for each prize, seen as an individual bet, and computed as a percentage by the formula f = rp/(1 – p), where r is the net payout rate (relative to the stake as the cost of the ticket) and p is the probability of winning that prize.
Expected value and house edge
Here, we will provide the values of these statistical indicators for the respective game and its options of playing, either as an exact number or an estimation.
Final remarks
This section will present conclusive remarks and advice based on the math facts provided, where available.
Category
Powerball is a combinatorial lottery game drawing from two independent pools: five numbers drawn from 1 – 69 (the base draw) and one number drawn from 1– 26 (the Power Ball).
Size of the draw: 6, that is, 5 + 1.
Size of a played line: 6, that is, 5 + 1.
Cost of a line: $2 (+ $1 for the option of Power Play or Double Play)
The game has two additional options: Power Play, where the base prizes are multiplied by a number to be drawn, and Double Play, allowing a ticket to participate in a second draw.
Prizes
There are nine tiers of prizes, defined as matching 1 to 6 numbers in the draw (1 for the Power Ball). They are all fixed prizes, except the top prize (6 numbers matched), which is a rolling-over jackpot.
The prizes do not increase uniformly from the lowest to the highest. There are abrupt jumps: from the 3rd tier to the 2nd tier ($100 to $50,000) and from the 6th tier to the 5th tier ($7 to $100). This also happens for the corresponding odds of winning.
Odds of winning
The odds of winning the Powerball jackpot in the base draw range from 1 in 292,201,338 (one of the lowest winning probabilities across lottery games and games of chance) to 1 in 38.32 (for the lowest prize). The overall odds of winning a prize in the base draw are 1 in 24.87.
If the Double Play is activated, the odds of winning each prize in either of the two draws are estimated in the next table:
| Prize tier | Odds of winning |
|---|---|
|
5 + 1 match |
1 in 146 million |
|
5 match |
1 in 5.84 million |
|
4 + 1 match |
1 in 456,500 |
|
4 match |
1 in 18,260 |
|
3 + 1 match |
1 in 7,247 |
|
3 match |
1 in 290 |
|
2 + 1 match |
1 in 350 |
|
1 + 1 match |
1 in 46 |
|
0 + 1 match |
1 in 19 |
The overall odds of winning a prize in either of the two draws are 1 in 12.70.
The following table lists the odds of winning each possible prize when the Power Play is activated, before the multiplier is drawn:
| Prize amount | Odds of winning |
|---|---|
|
$8 |
1 in 89.48 |
|
$12 |
1 in 48.47 |
|
$14 |
1 in 568 |
|
$16 |
1 in 388 |
|
$20 |
1 in 582 |
|
$21 |
1 in 1,049 |
|
$28 |
1 in 4,545 |
|
$35 |
1 in 6,817 |
|
$40 |
1 in 1,163 |
|
$70 |
1 in 13,635 |
|
$1,000 |
1 in 18,591 |
|
$1,500 |
1 in 34,322 |
|
$2,000 |
1 in 148,728 |
|
$2,500 |
1 in 223,093 |
|
$5,000 |
1 in 446,185 |
|
$100,000 |
1 in 1,636,023 |
|
$150,000 |
1 in 3,020,350 |
|
$200,000 |
1 in 13,088,180 |
|
$250,000 |
1 in 19,632,270 |
|
$500,000 |
1 in 39,264,550 |
|
$2,000,000 |
1 in 11,688,054 |
|
Jackpot |
1 in 292,201,338 |
Average win and fairness
The next table lists the average win for each prize in the base draw:
| Prize tier | Prize amount | Average win |
|---|---|---|
|
5 + 1 |
Jackpot |
Jackpot × its probability |
|
5 |
$1,000,000 |
$0.08556 |
|
4 + 1 |
$50,000 |
$0.05475 |
|
4 |
$100 |
$0.002737 |
|
3 + 1 |
$100 |
$0.006900 |
|
3 |
$7 |
$0.01207 |
|
2 + 1 |
$7 |
$0.009982 |
|
1 + 1 |
$4 |
$0.04350 |
|
0 + 1 |
$4 |
$0.1053 |
For an average jackpot of $424 million*, the average win is $1.45.
Example of use and interpretation of the table: Over the long run, a win in the 4 + 1 match tier is distributed as $0.05475 average win per line played (assuming the prize is won with the relative frequency of about 1 in 913,129 draws).
The next table lists the fairness of each prize in the base draw relative to its probability:
| Prize tier | Prize amount | Fairness |
|---|---|---|
|
5 + 1 |
Jackpot |
- |
|
5 |
$1,000,000 |
4.28% |
|
4 + 1 |
$50,000 |
2.74% |
|
4 |
$100 |
0.13% |
|
3 + 1 |
$100 |
0.33% |
|
3 |
$7 |
0.43% |
|
2 + 1 |
$7 |
0.35% |
|
1 + 1 |
$4 |
1.09% |
|
0 + 1 |
$4 |
2.70% |
For an average jackpot of $424 million*, its fairness would be 72.55%. However, this only applies in the circumstance where such a jackpot is actually won, as rollovers actually mean zero prizes in this tier.
The highest fairness is associated with the first two prize tiers, followed by the last tier. The least fair in the prize schedule is the prize for matching 4 numbers. As a comparison, a color bet in European roulette has a fairness of 94.70%, and a column bet has 43.82%.
*Note: The average jackpot was chosen as the average of the jackpots won as annuity in Powerball over the last 10 years.
Expected value and house edge
The precise expected value of the Powerball game cannot be obtained, as the first-tier prize is variable. It is yet relevant to estimate it** in two cases, associated with two assumptions:
- In this first case, we will consider the jackpot amount as zero (case justified by a long series of draws when the jackpot is not won, or it is in a low amount relative to its probability).
- In this second case, we will consider an average amount for the jackpot won over a period of time (say, the last 10 years).
In case A, the expected value is –$1.68, or –84% as a percentage of the line cost. The house edge of the game is 84%.
In case B, the expected value is –$0.23, or –11.5% as a percentage of the line cost. The house edge of the game is 11.5%.
As interpretation, in case A, you are expected to lose an average of $1.68 for every $2 invested, over the long run.
The above values correspond to the base play.
For the Double Play, the values are:
- In case A, the expected value is –$2.14, or –71.33% as a percentage of the line cost. The house edge of the game is 71.33%.
- In case B, the expected value is –$0.69, or –23% as a percentage of the line cost. The house edge of the game is 23%.
For the Power Play, the values are:
- In case A, the expected value is –$2.18, or –72.66% as a percentage of the line cost. The house edge of the game is 72.66%.
- In case B, the expected value is –$0.73, or –24.33% as a percentage of the line cost. The house edge of the game is 24.33%.
**Note: The calculations ignored jackpot splitting between several winners and any taxes.
Final remarks
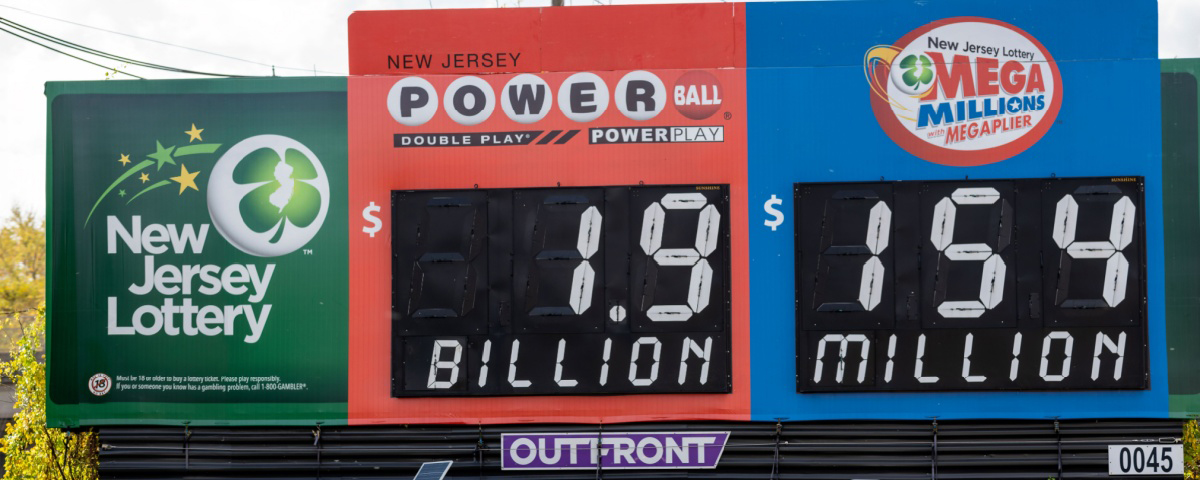
Powerball's rolling jackpots, which reach massive amounts due to the game's popularity, make it ideal for players chasing life-changing wins.
Despite the close to zero odds of winning the jackpot, that bet has decent fairness, given the actual jackpot amounts won. Adding that the bottom prize tiers offer very low prizes compared to the first three tiers, the game seems to be suitable for the chasers of life-changing wins, who might ignore the lower prizes and the overall balance loss-gain over the long run. For those players interested in this balance, the expected values associated with the different types of play indicate that there is no significant difference between the Double Play and the Power Play. As such, the Double Play is recommended between the two types just because it offers twice as high odds of winning something, which also impacts the short- to medium-run play.
Making a recommendation of choosing between the base play and either Double Play or Power Play is not straightforward: In case A, the base play has a house edge higher than the Double Play/Power Play, while in case B, the order is reversed. However, since the log run is concerned and the odds of winning the jackpot are “impossible” even over a lifetime, it is wise to adopt case A, which results in still recommending the Double Play over the base play, with the additional argument that the +$1 increase in the cost of a line is not a heavy cost and is also counterbalanced by higher odds of winning as an advantage.
Stay tuned for the next installment of The Math Behind, where we'll decode another popular lottery game's statistical blueprint.


Comments